
By William Lim, Broker-Associate | Prepared November 2, 2026
Market data extracted October 30, 2026.
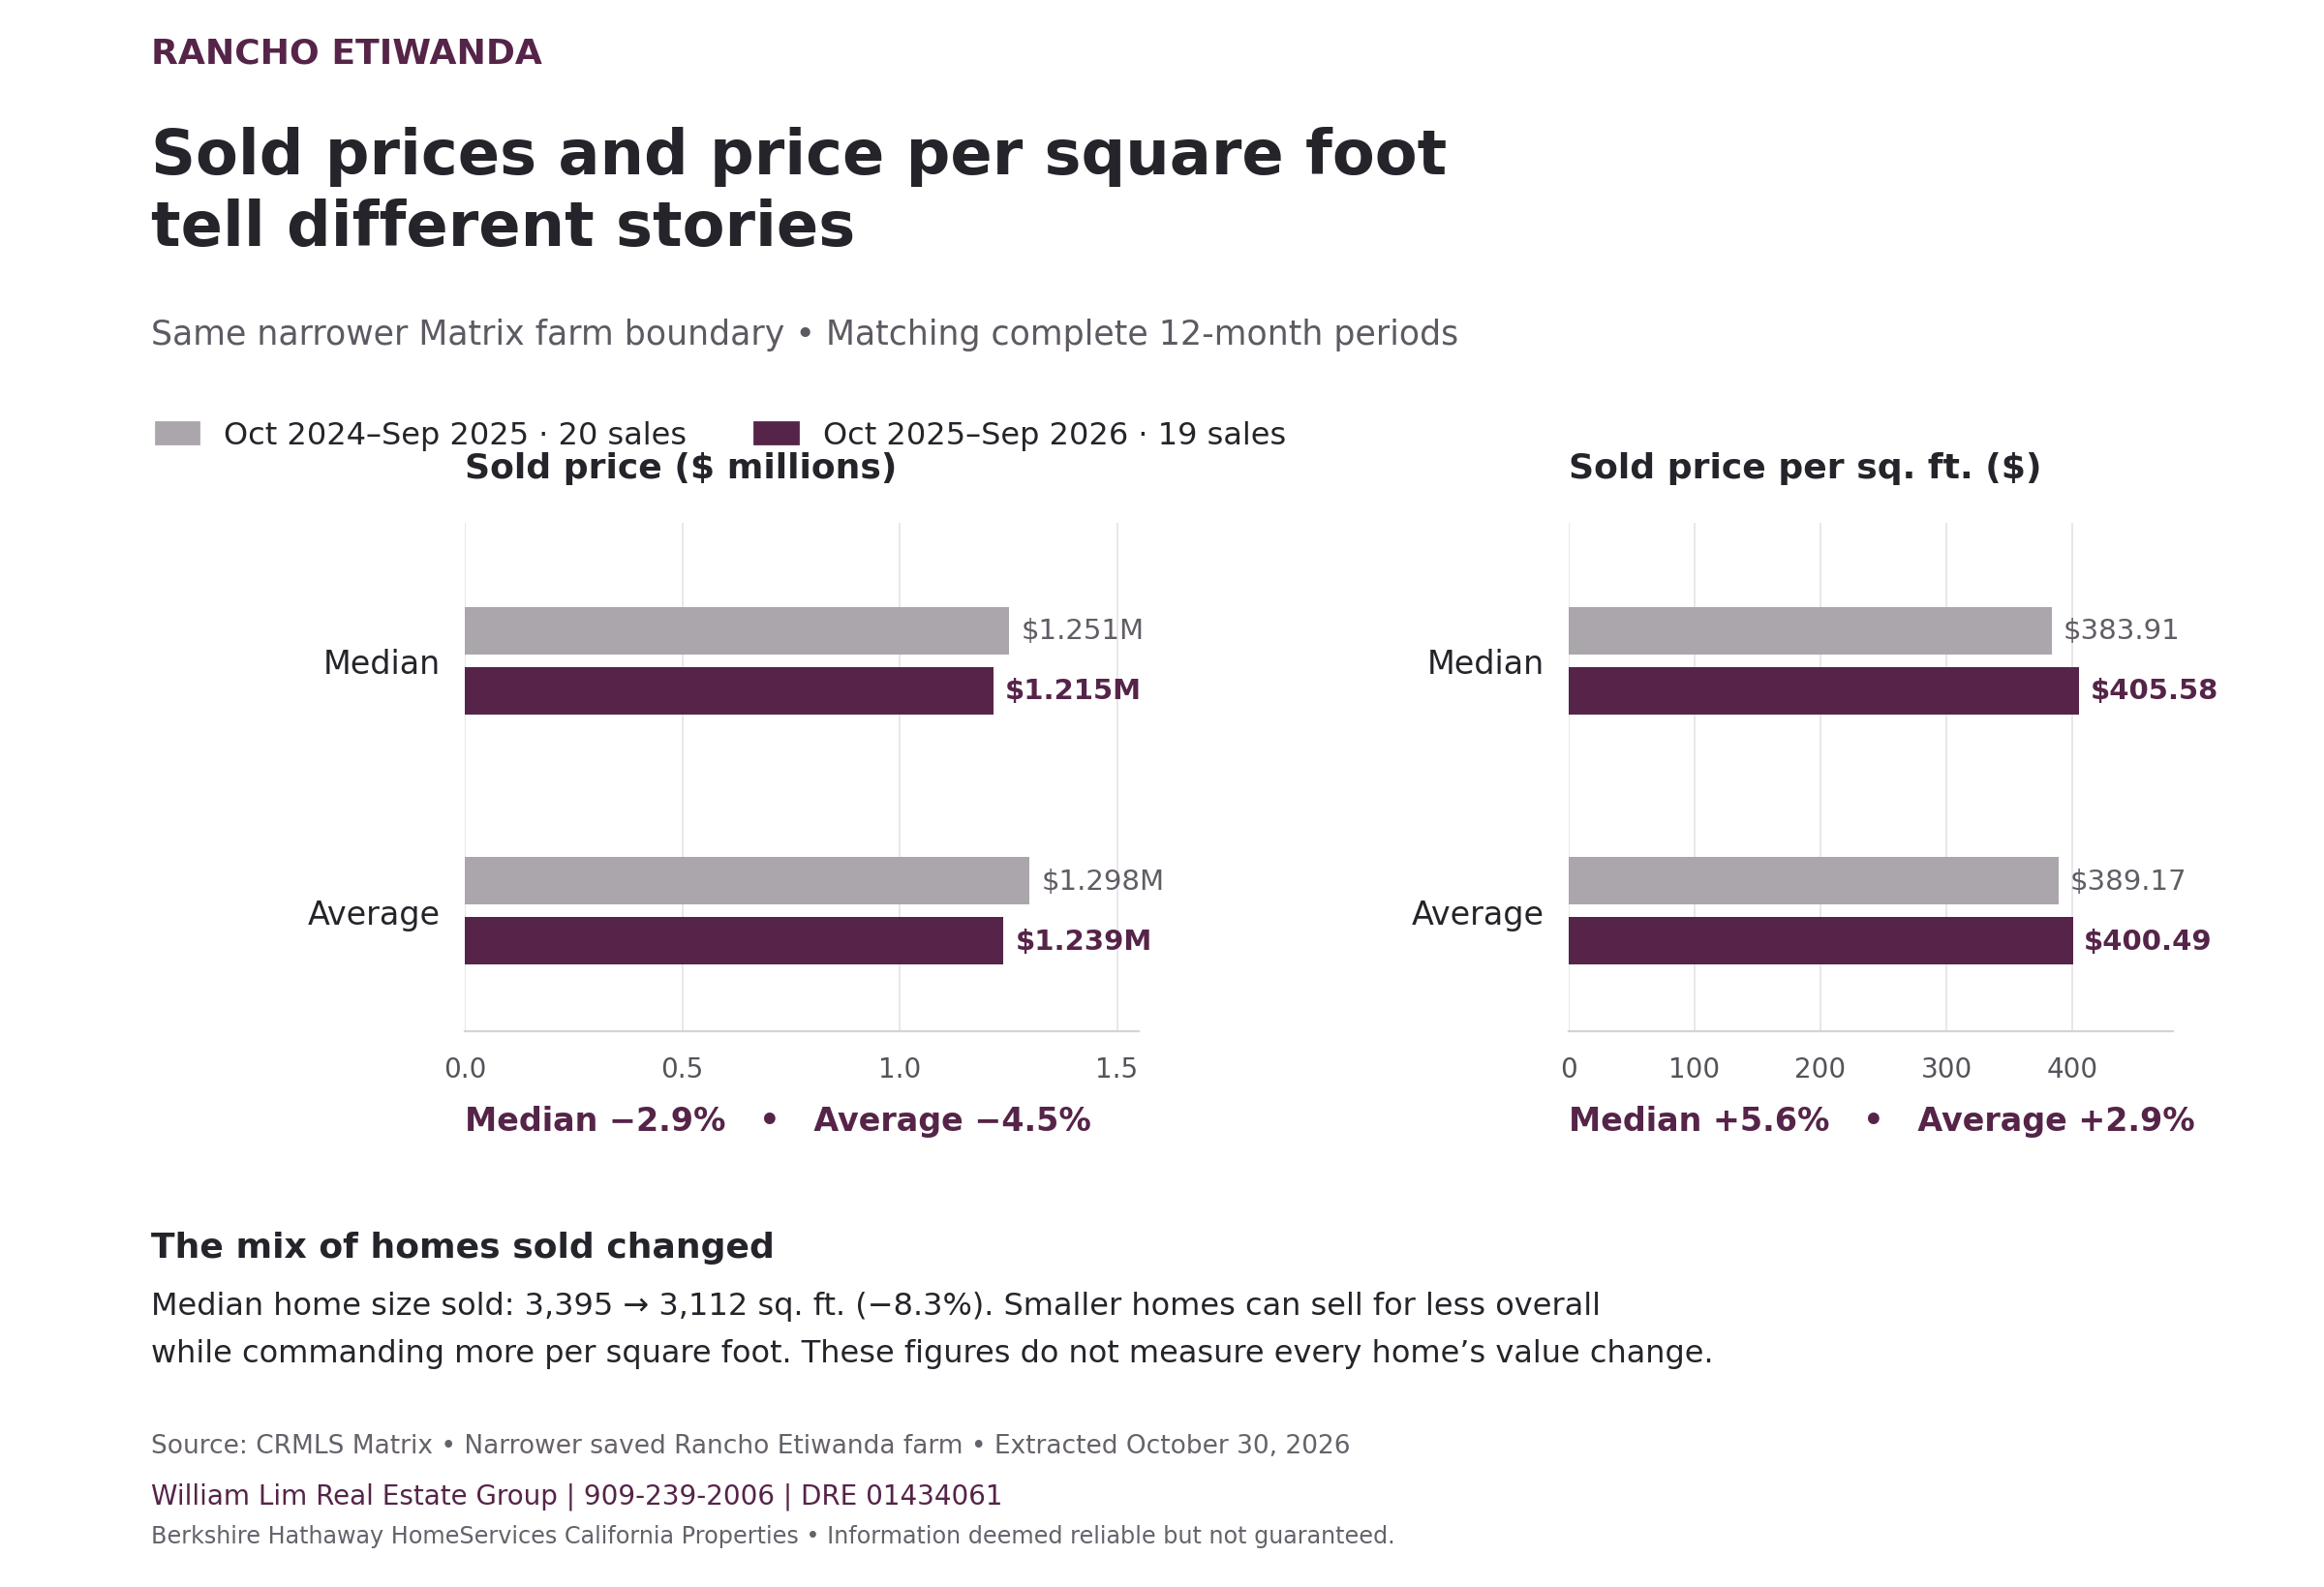
Are home prices in Rancho Etiwanda going up or down? Our neighborhood report shows why one headline cannot tell the whole story: the median sale price declined while the median price per square foot increased.
This update covers the specific non-gated Rancho Etiwanda farm boundary used in our CRMLS Matrix analysis. It does not cover the separate gated Rancho Etiwanda Estates neighborhood or all of Etiwanda.
The neighborhood at a glance
The comparison uses two complete, matching 12-month periods: October 2024–September 2025 and October 2025–September 2026.
| Measure | Oct. 2024–Sept. 2025 | Oct. 2025–Sept. 2026 | Change |
|---|---|---|---|
| Closed sales | 20 | 19 | −5.0% |
| Median sold price | $1,251,245 | $1,215,000 | −2.9% |
| Average sold price | $1,298,220 | $1,239,189 | −4.5% |
| Median sold price per sq. ft. | $383.91 | $405.58 | +5.6% |
| Average sold price per sq. ft. | $389.17 | $400.49 | +2.9% |
| Median home size sold | 3,395 sq. ft. | 3,112 sq. ft. | −8.3% |
Why can sale prices fall while price per square foot rises?
The homes sold in the more recent period were smaller at the median. A different mix of homes can pull the overall sale price down even while the price paid per square foot rises.
Size is only part of the picture. Condition, upgrades, lot characteristics, pools and location also affect how homes compare. Smaller homes can sell for more per square foot, so dividing by size does not fully account for differences between properties.
These figures describe the homes that sold. They do not establish that every home lost 2.9% in value or gained 5.6%. Neither number is an individual property’s appreciation rate.
A closer look at the latest six months
For April–September 2026, 14 homes closed compared with 10 in the same months of 2025. The median sale price fell from $1,334,000 to $1,185,000, a decline of 11.2%, while median sold price per square foot increased 3.6%.
The same mixed pattern appears in this shorter window. More homes closed, but the typical home sold was smaller. With only 10 and 14 transactions in these comparison groups, a few different sales can substantially change the results. Study comparable properties rather than apply a neighborhood percentage directly to your home.
Available homes: an October 30 snapshot
The October 30 export showed five active listings and one home under contract within the saved farm boundary. Active asking prices ranged from $1,099,900 to $1,640,000.
These are dated listing figures, not a live inventory count. Asking prices show seller expectations; they are not completed sale prices. Availability and pricing may have changed since the export.
What does this mean if you are thinking about selling?
Start with the most comparable recent sales, then examine the homes buyers can choose from today. A useful pricing review considers your home’s size, condition, improvements, lot and location, along with current competition.
Preparation and a realistic asking price deserve attention. The neighborhood report provides context; your home needs its own plan. Before making a pricing decision, I recommend refreshing the comparable sales and active listings for your particular property.
What does this mean for buyers?
Look beyond the headline price and compare what each home offers. A lower price per square foot does not automatically make a home the better purchase, and a lower neighborhood median does not mean every seller will accept the same discount.
Evaluate comparable sales, condition, likely repair needs and competing options together. That creates a more useful basis for an offer than a single neighborhood-wide percentage.
Let’s talk about your home
Planning your next step? Explore our home-selling guide or request a personalized home value review.
If you are considering a move in Rancho Etiwanda, I would be happy to review the comparable sales and help you understand how your property fits into the neighborhood market.
Call William Lim at 909-239-2006.
William Lim Real Estate Group
Berkshire Hathaway HomeServices California Properties
William Lim, Broker-Associate | DRE 01434061
Source: CRMLS Matrix, saved Rancho Etiwanda non-gated farm search, narrower saved map boundary; export dated October 30, 2026. Annual comparison: October 1, 2025–September 30, 2026 (19 closed sales) versus October 1, 2024–September 30, 2025 (20 closed sales). Six-month comparison: April–September 2026 (14 sales) versus April–September 2025 (10 sales). Includes sales by other brokers. Price-per-square-foot statistics use each closed sale price divided by its living area. This is a descriptive transaction analysis, not a repeat-sales or quality-adjusted valuation index. Information deemed reliable but not guaranteed. Listing status and pricing are subject to change.


